


PART 2. Focusing of ions with FAIMS
A complete description can be found in:On-line issues
for Review of Scientific Instruments: FAIMS papers can be found in the December
1998 and the February 1999 issues.
Review Scientific Instruments Dec 1998
Review Scientific Instruments Feb 1999
What does focusing of ions mean? Consider the transmission of ions between flat plates (Figure 1) and cylindrical plates (Figure 2). The ions exit the cylindrical plate system at fixed radial location. This means the ions are focused towards a fixed radial position between the electrodes. They are distribute around this ideal location because of diffusion, space charge ion-ion repulsion and gas turbulence/movement.
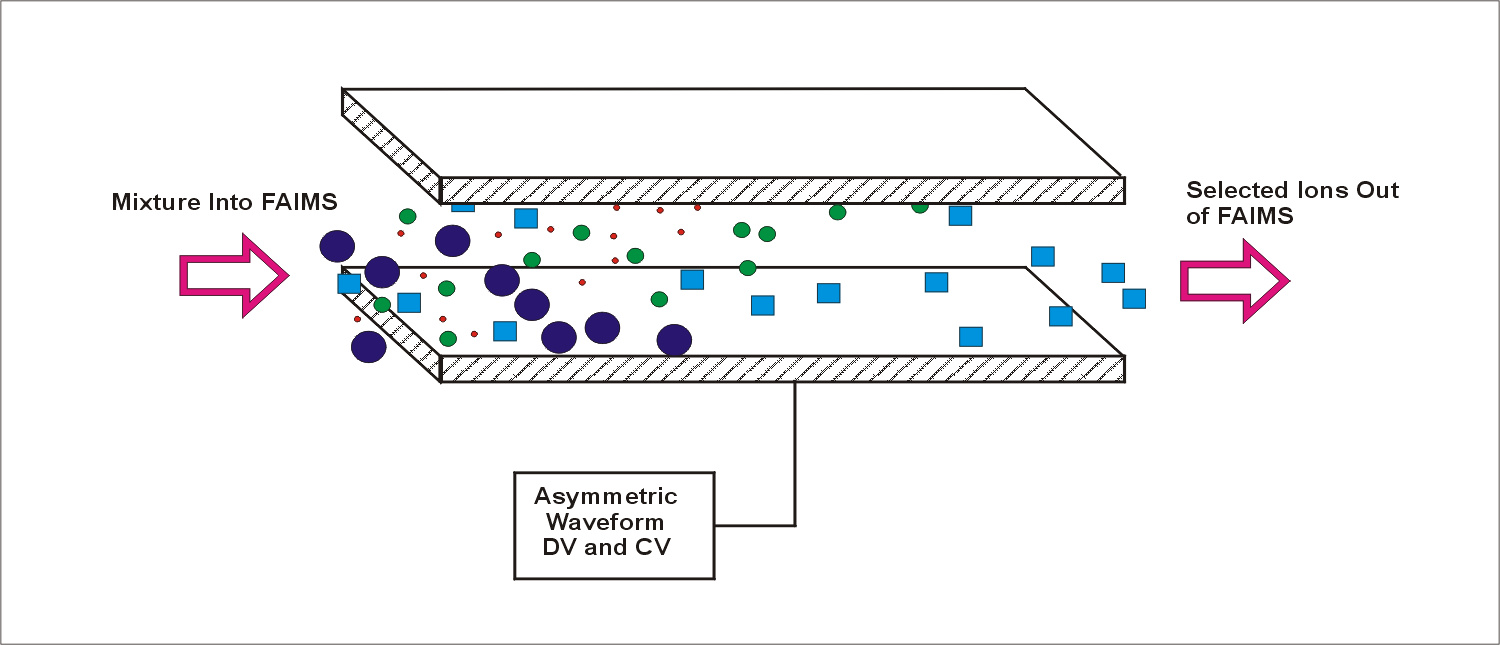
Figure 1. Ions separated between flat plates in the FAIMS analyzer. The transmitted ion is distributed evenly over the space between the plates. The transmitted ion is lost continuously through diffusion and space charge repulsion.
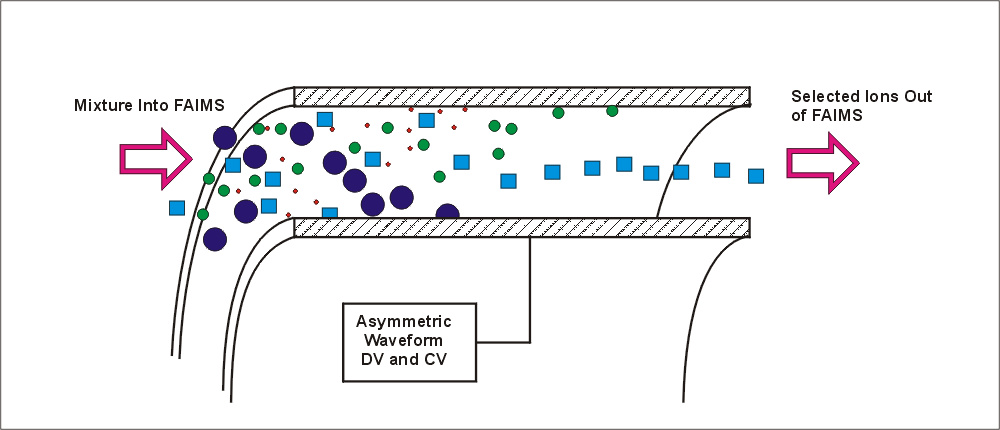
Figure 2. Ions separated between concentric cylinders of a FAIMS analyzer. The transmitted ion is focused towards a fixed radial distance, and distributed around that distance through the effects of diffusion and space charge repulsion. The effect of the focus is exaggerated for clarity in this figure.
HOW and WHY are the ions Focused?
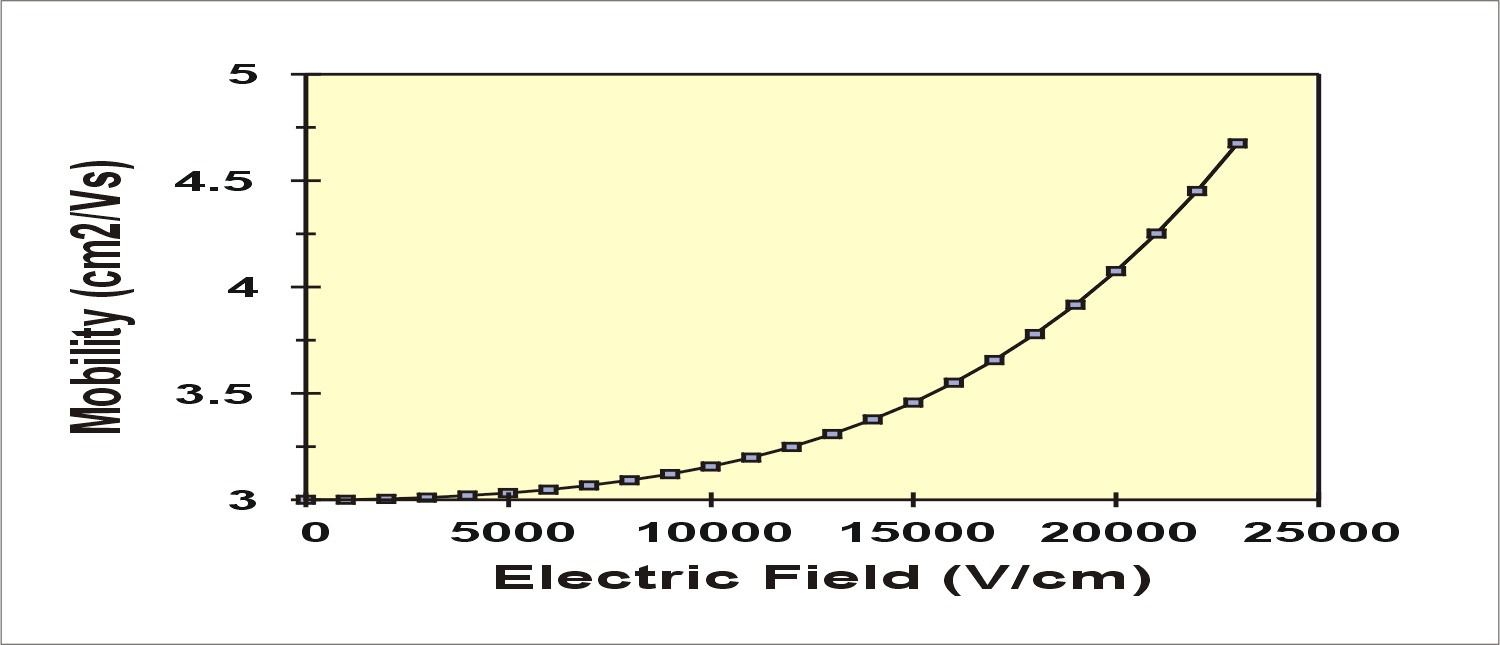
Step #1. Assume that the high-field ion mobility changes as shown in the figure below (and assume that we are considering a sodium ion, Na+). The mobility at high field, for this description, is assumed to be described by the equation: Kh = K (1+alpha*E2+beta*E4) where alpha equals 4.0E-10 and beta is 1.24E-18. The mobility at the low field limit, K, is assumed to be 3.0. The figure below shows the change in Kh , the mobility at high electric field, up to over 20,000 volts/cm.
Figure
3. Assumed change ion mobility of sodium ion at high electric field
strength. This change in mobility has not been determined experimentally,
and is being used here for illustrative purposes only.
Step #2. Assume a cylindrical FAIMS with geometry inner cylinder 1 mm radius and outer cylinder 3 mm radius. Apply a square wave asymmetric waveform with a high to low voltage ratio of 5 to 1. This means that there are two conditions of electric field. During the high voltage period, the fields may be in excess of 15,000 volts/cm and during the low voltage period the fields are about -3000 volts/cm . Figure 4 shows the calculated electric fields at 5 selected locations between the inner and outer cylinders. The fields during the high voltage part of the waveform are shown as bars in the positive direction and the fields in the opposite polarity, low voltage part of the wave are shown as bars in the negative direction. The fields are noted on the bars, but if you try to reproduce the numbers, don't forget that a CV of -35 volts has been added to the waveform (focusing conditions for the sodium ion) as shown in the notes in the lower left corner of the figure.
Also note that
the conditions at the inner and outer edge will not be very meaningful in
terms of the motion of an ion, since the ion would hit one or the other wall.
The fields, and distances of ion motion, that follow in this description are
for illustrative purposes only, and we will ignore the "unrealistic"
conditions at the very edges of the inner and outer electrodes.
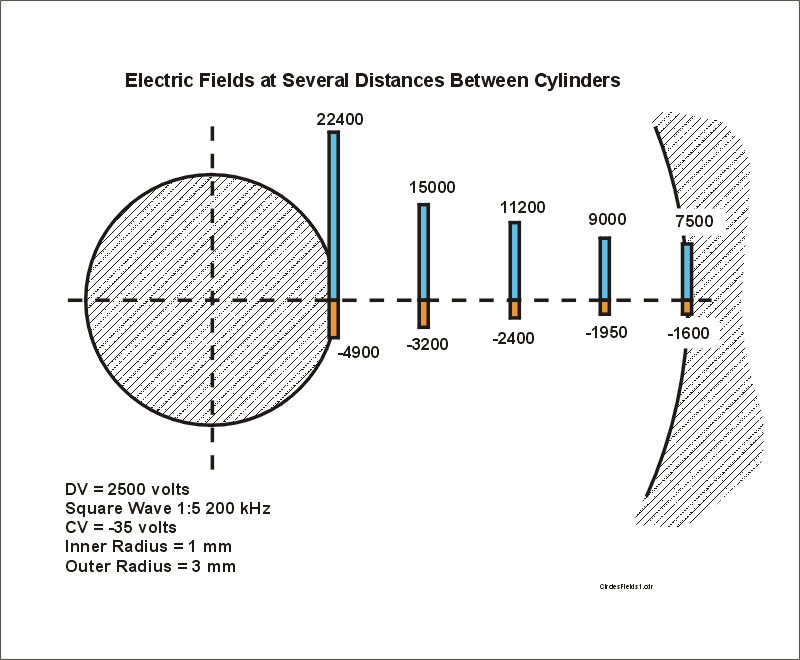
Figure 4. The electric fields during the positive and negative portions of a hypothetical square wave asymmetric waveform applied to concentric cylinders 1 and 3 mm radius. The waveform is applied to the inner cylinder. DV is 2500 volts and CV is -35 volts because we will use the conditions for focus of sodium ion in this illustration.
Step #3. We next calculate the ion mobility at each of the electric fields that appear in the previous figure. Note that at high electric fields the mobility increases very rapidly. Note also that the ion mobility values that appear for the electric fields in the reverse polarity part of the waveform, i.e. the yellow bars extending downward in the next figure, are almost constant. In this case the mobility during the positive part of the waveform can get above 3.5 cm^2/Vs, but the mobility during the reverse part of the wave barely deviate from the low field limit of 3.0 cm^2/Vs.
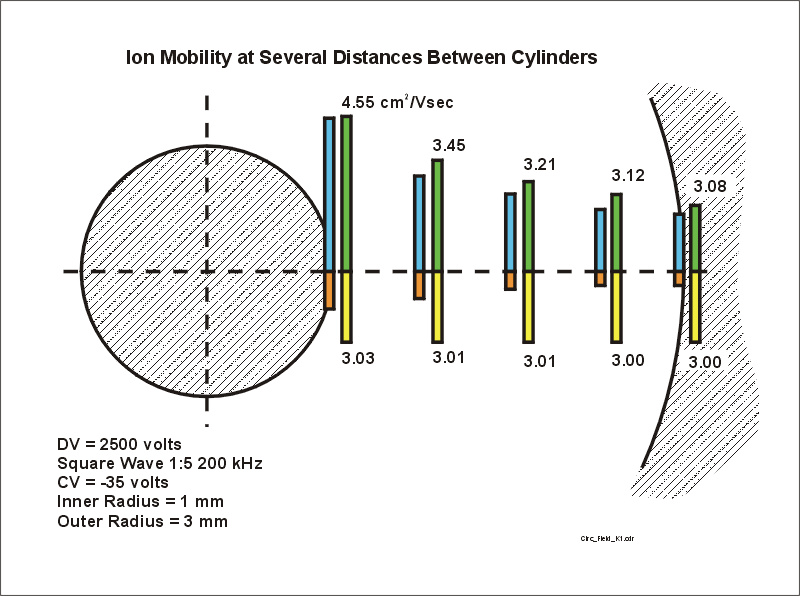
Figure 5. The mobility of the ion during the positive part of the waveform (green bars) and during the negative part of the waveform (yellow bars).
Step #4. By now you know (or can guess) where this discussion is heading. The next figure shows red bars which represent the distance the ion would move during only the negative part of the waveform (thus the ions move towards the inner electrode). We ignore the fact that the ion would hit the inner electrode.
Note that the distance that the ion moves is essentially proportional to the strength of the electric field (orange bars) during this negative part of the waveform. This is because the mobility barely moves from 3.0 cm^2/Vs. In this case the velocity of the ion is the product of E and K, but K is almost constant. The velocity is then proportional to E. The distance travelled is therefore also proportional to E.
The ion motion during the negative portion of the waveform is therefore much like one expects in a low-field cylindrical device. The result is fairly boring.
Things get more
interesting if we now add the motion during the positive part of the waveform.
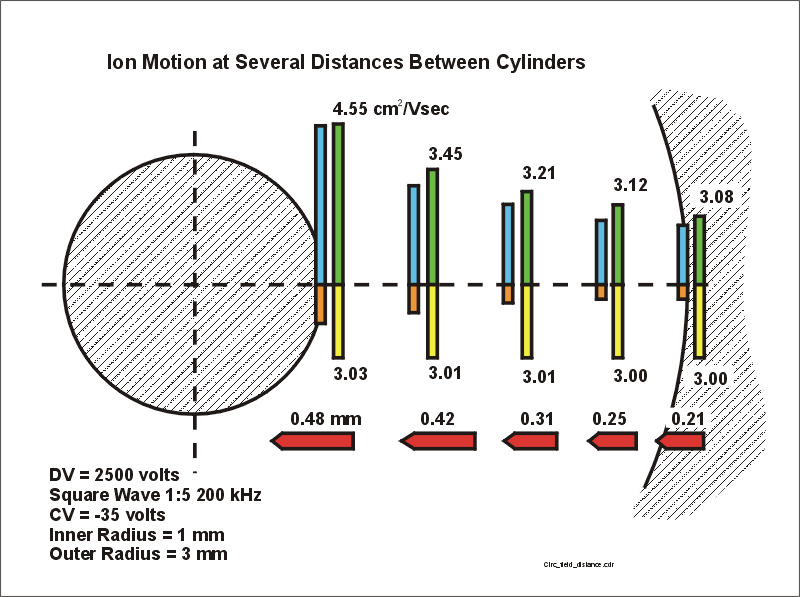
Figure 6.
Motion of the ion during the negative portion of the waveform. The distance
the ion has traveled is noted.
The figure below shows a set of blue bars which represent the distance the ion travels during the positive part of the waveform. Because of the change in ion mobility at high electric field, there are very much larger changes in the distances moved during this positive, high voltage, part of the waveform. The net distance must now reflect the field, as shown for the positive part of the wave (blue bars), plus the added component due to the change in the mobility (green bars) as well as the time of the applied positive portion of the waveform.
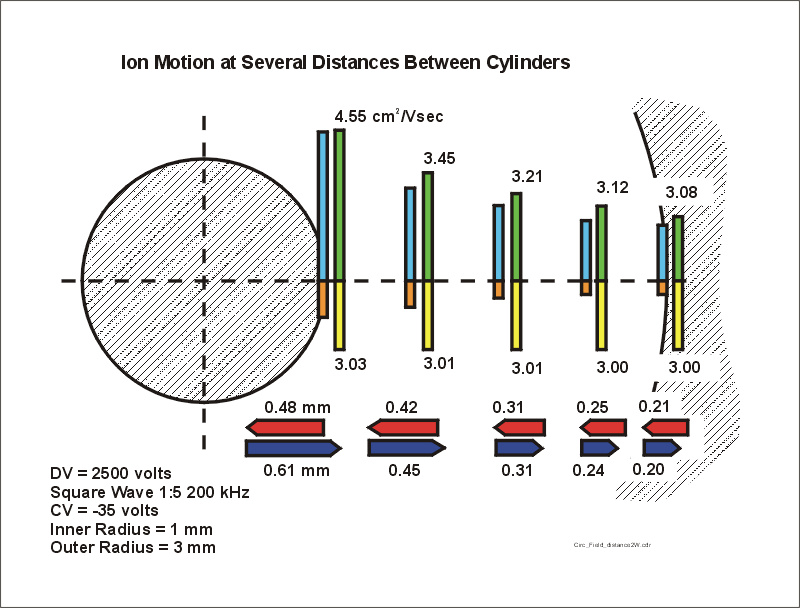
Figure
7. This
is identical to figure 6, but the horizontal blue bars represent the distance
the ion moves during the positive portion of the waveform.
Step #5. In step 4 we determined the net distance traveled by the ion during the positive and negative parts of the waveform, for each of the physical radial locations shown in the series of figures. We now determine the net motion of the ion which will occur during the total waveform by subtracting the distances traveled during the positive and negative parts of the waveform. The figure below has replaced the two distance bars (red and blue) with a single, net distance bar.
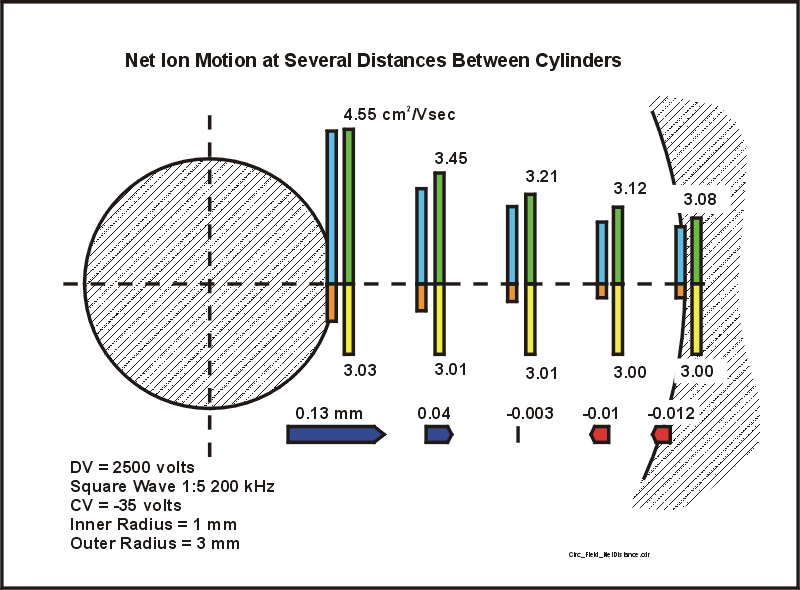
Figure 8. The net distance the ion has moved during one complete cycle of the waveform. The distances in the positive and negative parts of the waveform (red and blue bars in figure 7) have been replaced by one, net distance. If the net distance is away from the inner cylinder, the bar is blue, and if the net distance is directed towards the inner cylinder, the bar is red.
THE CONCLUSION: Figure 8 shows the focusing action of FAIMS. If the ion is near the inner electrode, it will migrate away from the inner electrode. If the ion is near the outer electrode, it will migrate towards the center of the space between the two electrodes. Although the ions feel a force which directs them towards this focus point please note that (a) the force is not necessarily strong and (b) the ions are being distributed in space around this focus point due to the influences of diffusion, space charge and ion-ion repulsion, and bath gas motions.